AI Observability and Monitoring
AI Observability and Monitoring
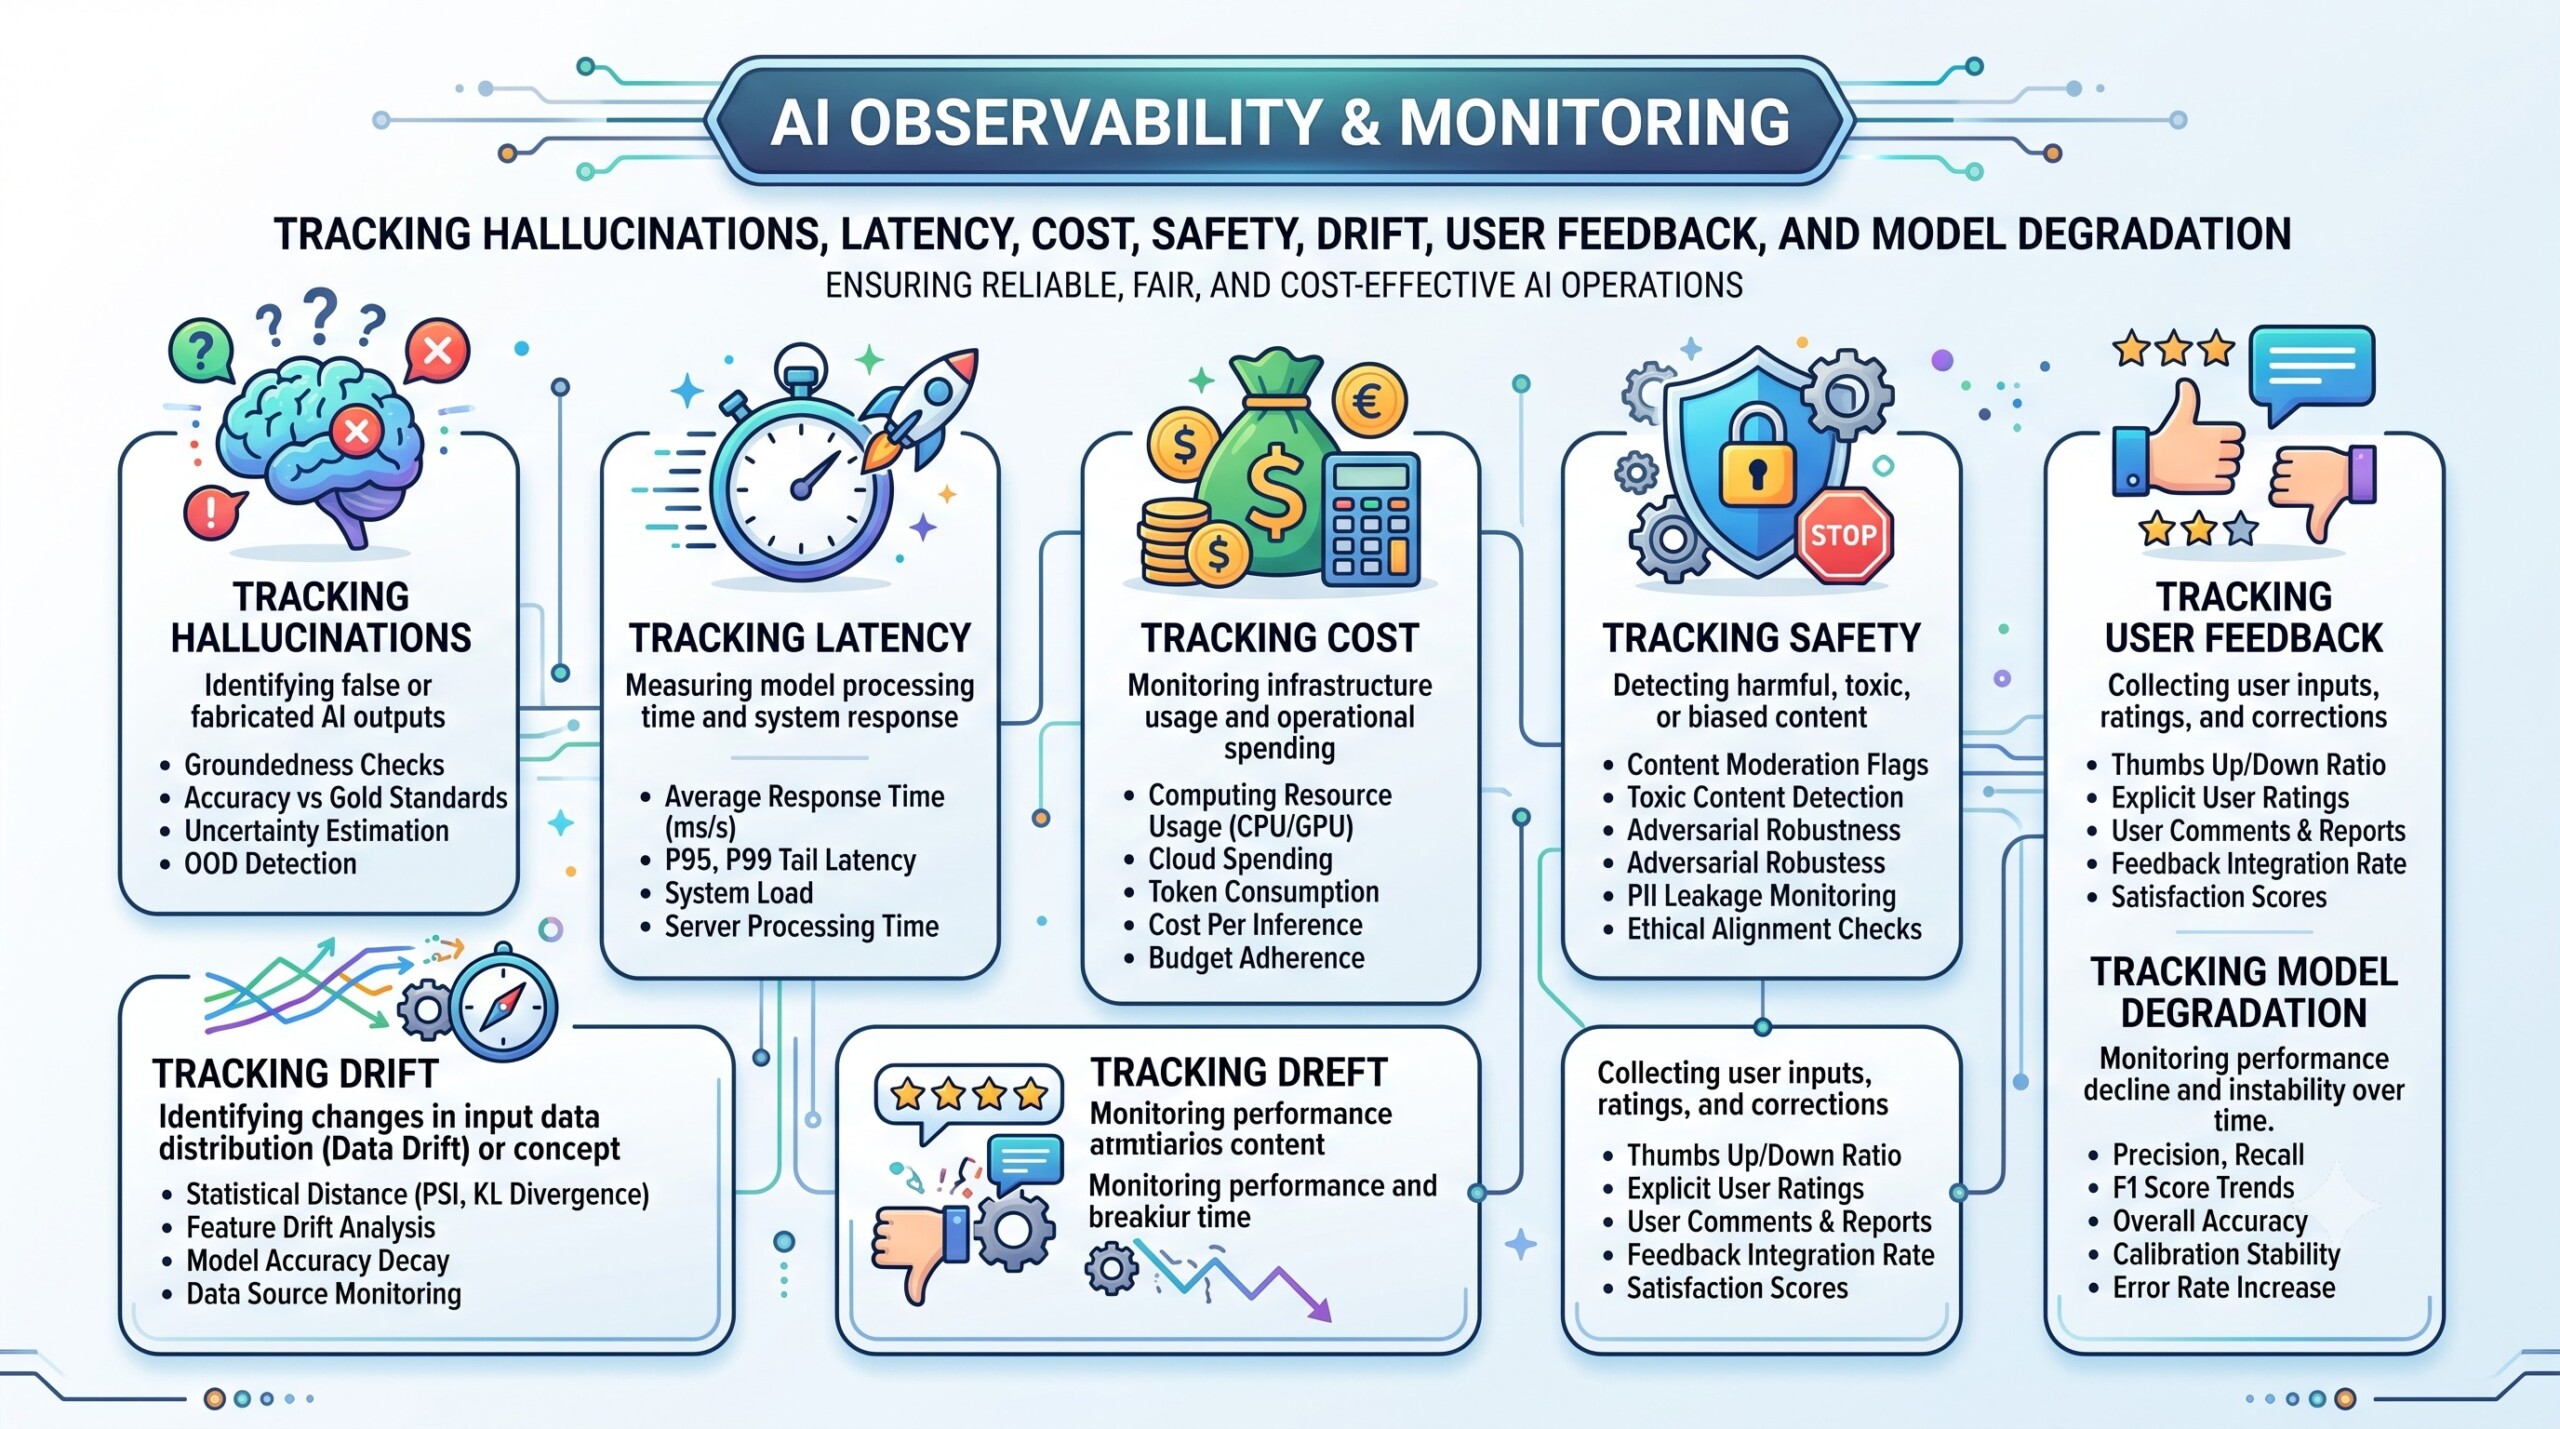
Tracking hallucinations, latency, cost, safety, drift, user feedback, and model degradation
Introduction
Artificial intelligence systems do not behave like conventional software. A traditional application generally produces the same result when it receives the same input under the same conditions. Generative AI systems are probabilistic: their outputs can vary, an answer can sound convincing while being wrong, and a seemingly minor change to a prompt, model, knowledge base or tool can alter system behaviour.
This makes conventional infrastructure monitoring necessary but insufficient. It is still important to know whether servers are available, APIs are returning errors and databases are responding. However, an AI application can be technically healthy while producing irrelevant, unsafe, ungrounded or commercially useless answers.
AI monitoring tracks known indicators such as latency, error rates, token consumption and safety violations. AI observability goes further: it gives teams enough traces, metrics, evaluations, outputs and contextual information to understand why a system behaved as it did.
Observability has now become a central part of enterprise AI engineering. Microsoft Foundry describes it as the combination of tracing, evaluation, production monitoring and automated quality gates. OpenTelemetry’s generative-AI conventions are helping standardise how model calls, tool calls, token usage and agent activity are recorded across platforms.
Let’s dive deep into the topic now.
1. Build a unified observability foundation
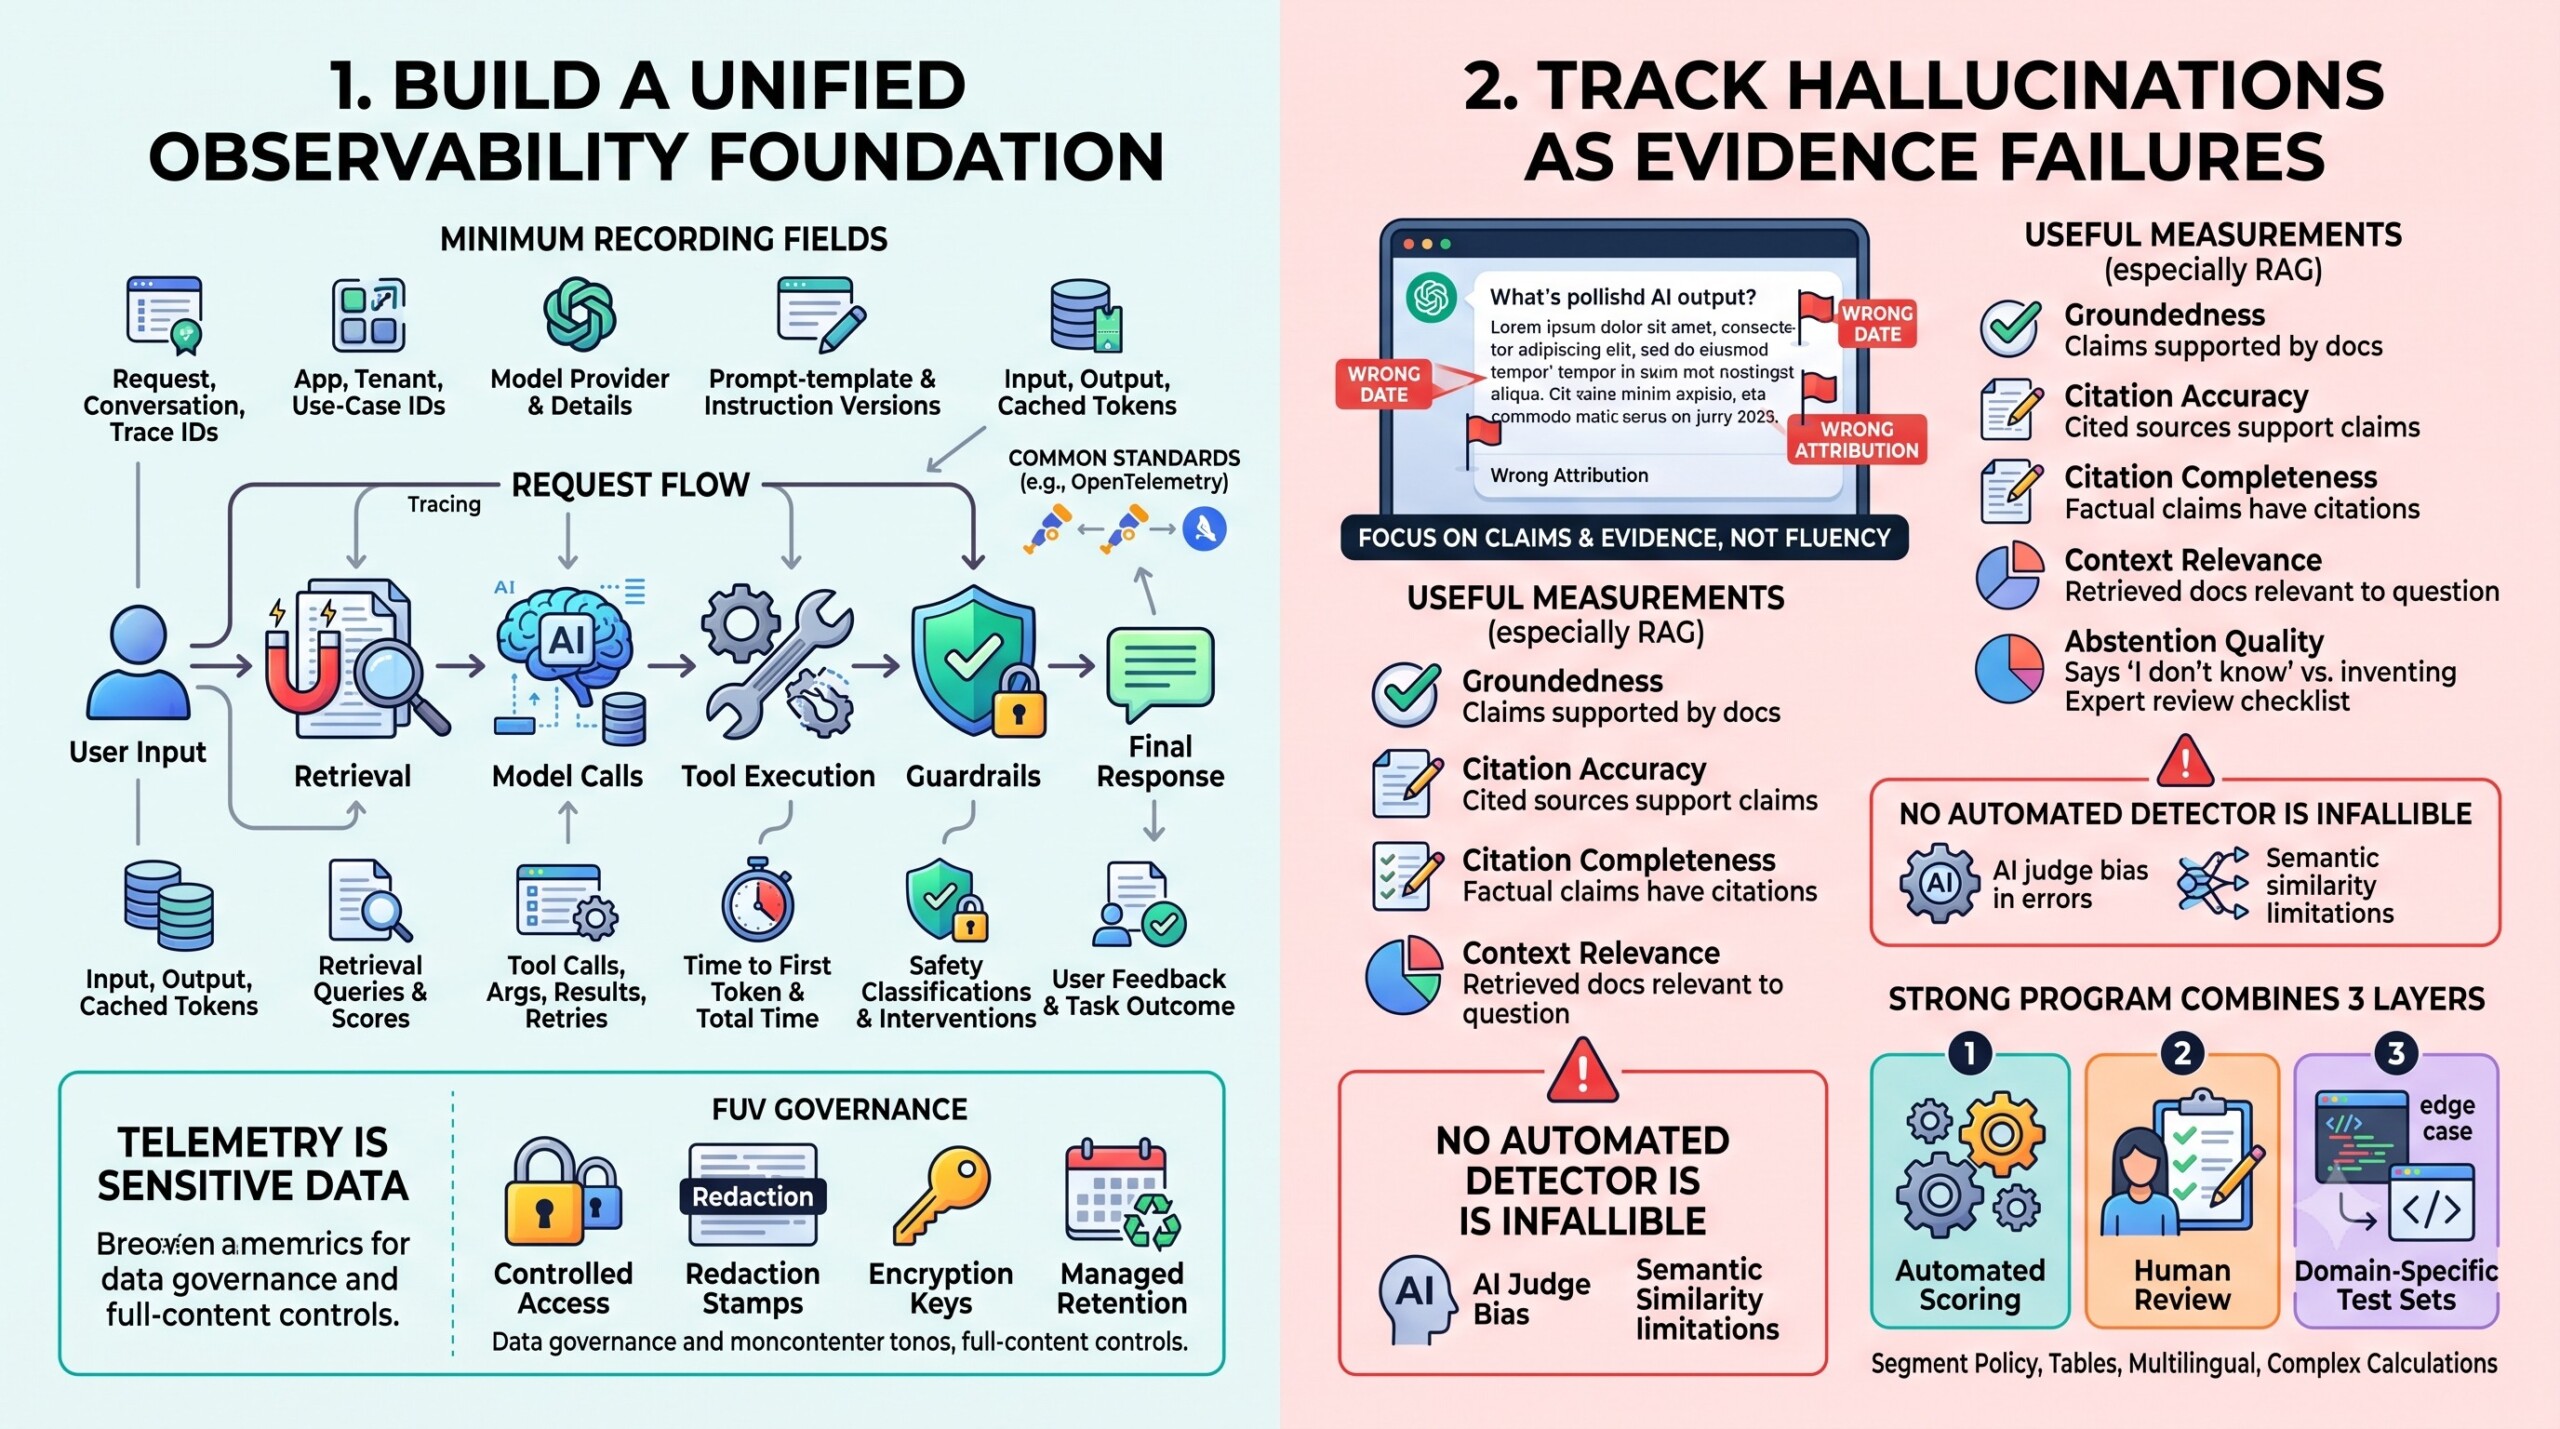
The first requirement is a common telemetry structure across the entire AI application. Each request should be traceable from the user’s input through retrieval, model calls, tool execution, guardrails and final response.
At minimum, an enterprise should consider recording:
- A unique request, conversation and trace identifier
- Application, tenant and use-case identifiers
- Model provider, model name and model version
- Prompt-template and system-instruction versions
- Input, output and cached-token counts
- Retrieval queries, document identifiers and relevance scores
- Tool calls, arguments, results, failures and retries
- Time to first token and total completion time
- Safety classifications and guardrail interventions
- User feedback and eventual task outcome
OpenTelemetry’s generative-AI work provides common conventions for recording models, token counts, prompts, completions, tools and results. This is important because an enterprise may use several model providers, agent frameworks and monitoring products. A common schema makes it easier to correlate behaviour across them rather than creating a separate dashboard for every vendor. Tracing is especially important for agents. An apparently incorrect final response may have been caused by poor retrieval, an invalid tool argument, a failed API call, an unnecessary retry or a misleading intermediate result. Modern agent tracing platforms can capture inputs, outputs, tool usage, costs, retries and latency for each step in the execution chain.
However, capturing everything is not automatically good observability. Prompts, documents and outputs may contain personal, financial, commercial or confidential information. Full-content logging should be explicitly controlled, redacted where possible, encrypted, access-restricted and retained only as long as necessary. Amazon Bedrock’s documentation, for example, notes that enabled invocation logging can send model inputs and outputs to logging or storage services; this illustrates why telemetry itself must be governed as sensitive data.
2. Track hallucinations as evidence failures
A hallucination is not simply an answer that someone dislikes. It is an output containing claims that are false, fabricated, misleading or unsupported by the information the system was expected to use.
Hallucination monitoring should therefore focus on claims and evidence, not merely on the fluency of the complete response. A polished paragraph can contain one incorrect number, date or attribution that creates serious consequences.
For retrieval-augmented generation systems, useful measurements include:
- Groundedness: Whether claims are supported by the retrieved material
- Citation accuracy: Whether cited sources actually support the associated claim
- Citation completeness: Whether factual claims that require evidence have citations
- Context relevance: Whether the retrieved documents are relevant to the question
- Unsupported-claim rate: The proportion of claims not supported by supplied evidence
- Abstention quality: Whether the model says it lacks evidence rather than inventing an answer
- Human-confirmed factual error rate: Errors verified through expert review
Google Cloud’s generative-AI evaluation service includes a grounding metric that checks factuality and consistency against supplied source text. Microsoft similarly identifies groundedness and relevance as important RAG evaluation dimensions. No automated hallucination detector should be treated as an infallible referee. An LLM judge may reproduce the biases or weaknesses of the system it is evaluating. Semantic-similarity scores can miss claims that sound similar to a source while changing a crucial date, quantity or relationship. NIST’s 2026 report on deployed-AI monitoring identifies the absence of reliable ground truth and golden datasets as a major barrier to measuring LLM performance.
A strong programme consequently combines three layers: automated scoring for broad coverage, human review for high-risk samples, and domain-specific test sets containing known correct answers and difficult edge cases. Hallucination metrics should also be segmented. A system may have excellent groundedness for general policy questions but fail on tables, recent events, multilingual prompts or complex calculations. A single organisation-wide “accuracy score” can conceal these weaknesses. An excellent collection of learning videos awaits you on our Youtube channel.
3. Measure latency across the entire user journey
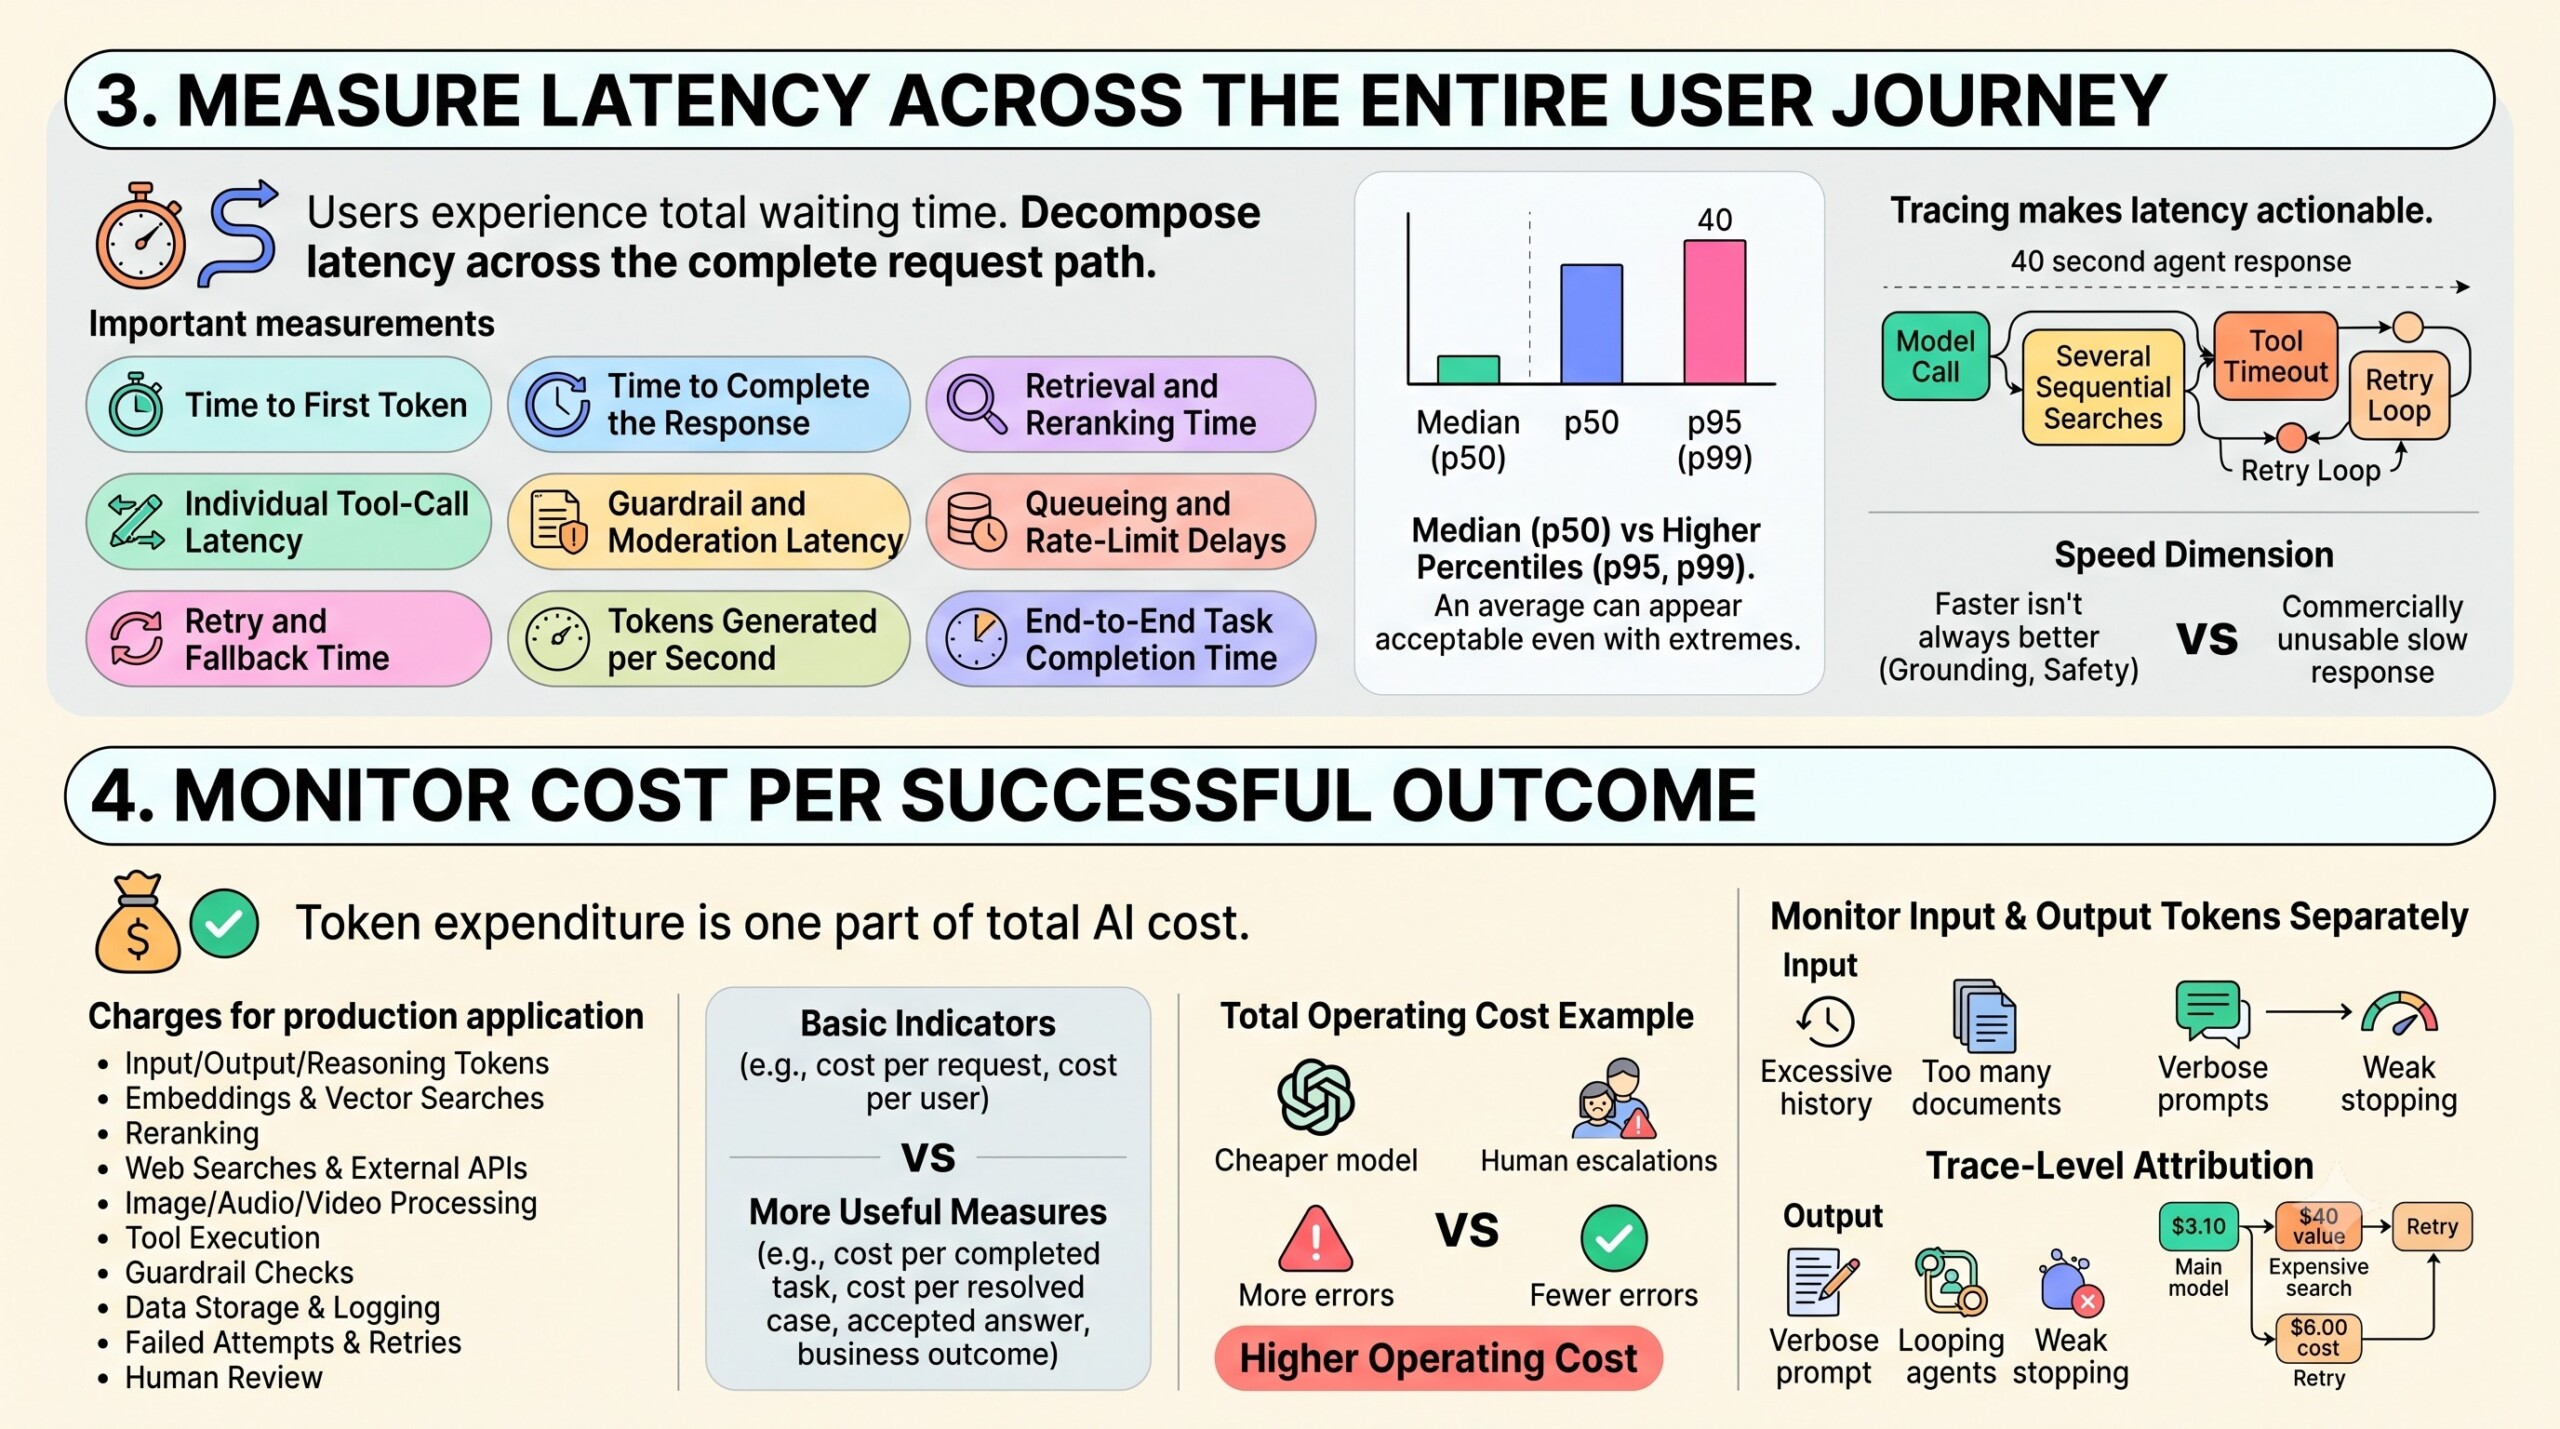
Users experience the total waiting time, not merely the model’s inference time. Latency must therefore be decomposed across the complete request path.
Important measurements include:
- Time to first token
- Time to complete the response
- Retrieval and reranking time
- Individual tool-call latency
- Guardrail and moderation latency
- Queueing and rate-limit delays
- Retry and fallback time
- Tokens generated per second
- End-to-end task completion time
These values should be measured at the median and at higher percentiles such as p95 and p99. An average can appear acceptable even when a significant minority of users encounter extremely slow responses.
Tracing makes latency actionable. A forty-second agent response may reflect a slow model, but it may instead result from several sequential searches, a tool timeout or an agent repeatedly reconsidering the same step. OpenTelemetry’s 2026 generative-AI observability guidance highlights this need to distinguish model calls, tool invocations and retry loops.
Latency also has a quality dimension. A faster answer is not necessarily better when it sacrifices grounding or safety. Conversely, an application that takes a minute to answer a simple question may be commercially unusable, regardless of benchmark quality.

4. Monitor cost per successful outcome
Token expenditure is one part of AI cost, not the complete measure.
A production application can incur charges for:
- Input, output and reasoning tokens
- Embeddings and vector searches
- Reranking
- Web searches and external APIs
- Image, audio and video processing
- Tool execution
- Guardrail checks
- Data storage and logging
- Failed attempts and retries
- Human review and exception handling
The most basic cost indicators are cost per request and cost per user. More useful measures are cost per completed task, cost per resolved case, cost per accepted answer and cost per business outcome. For example, a cheaper model that produces more failed answers may create additional conversations, escalations and manual work. Its token cost may be lower while its total operating cost is higher.
Monitor input and output tokens separately because they reveal different problems. Rising input-token use may indicate excessive conversation history or retrieval of too many documents. Rising output-token use may indicate overly verbose prompts, looping agents or weak stopping conditions.
Costs should also be attributed to individual steps. An agent may call the main model once but use an expensive search or reasoning model repeatedly during intermediate stages. Trace-level attribution reveals where the budget is actually being consumed. A constantly updated Whatsapp channel awaits your participation.
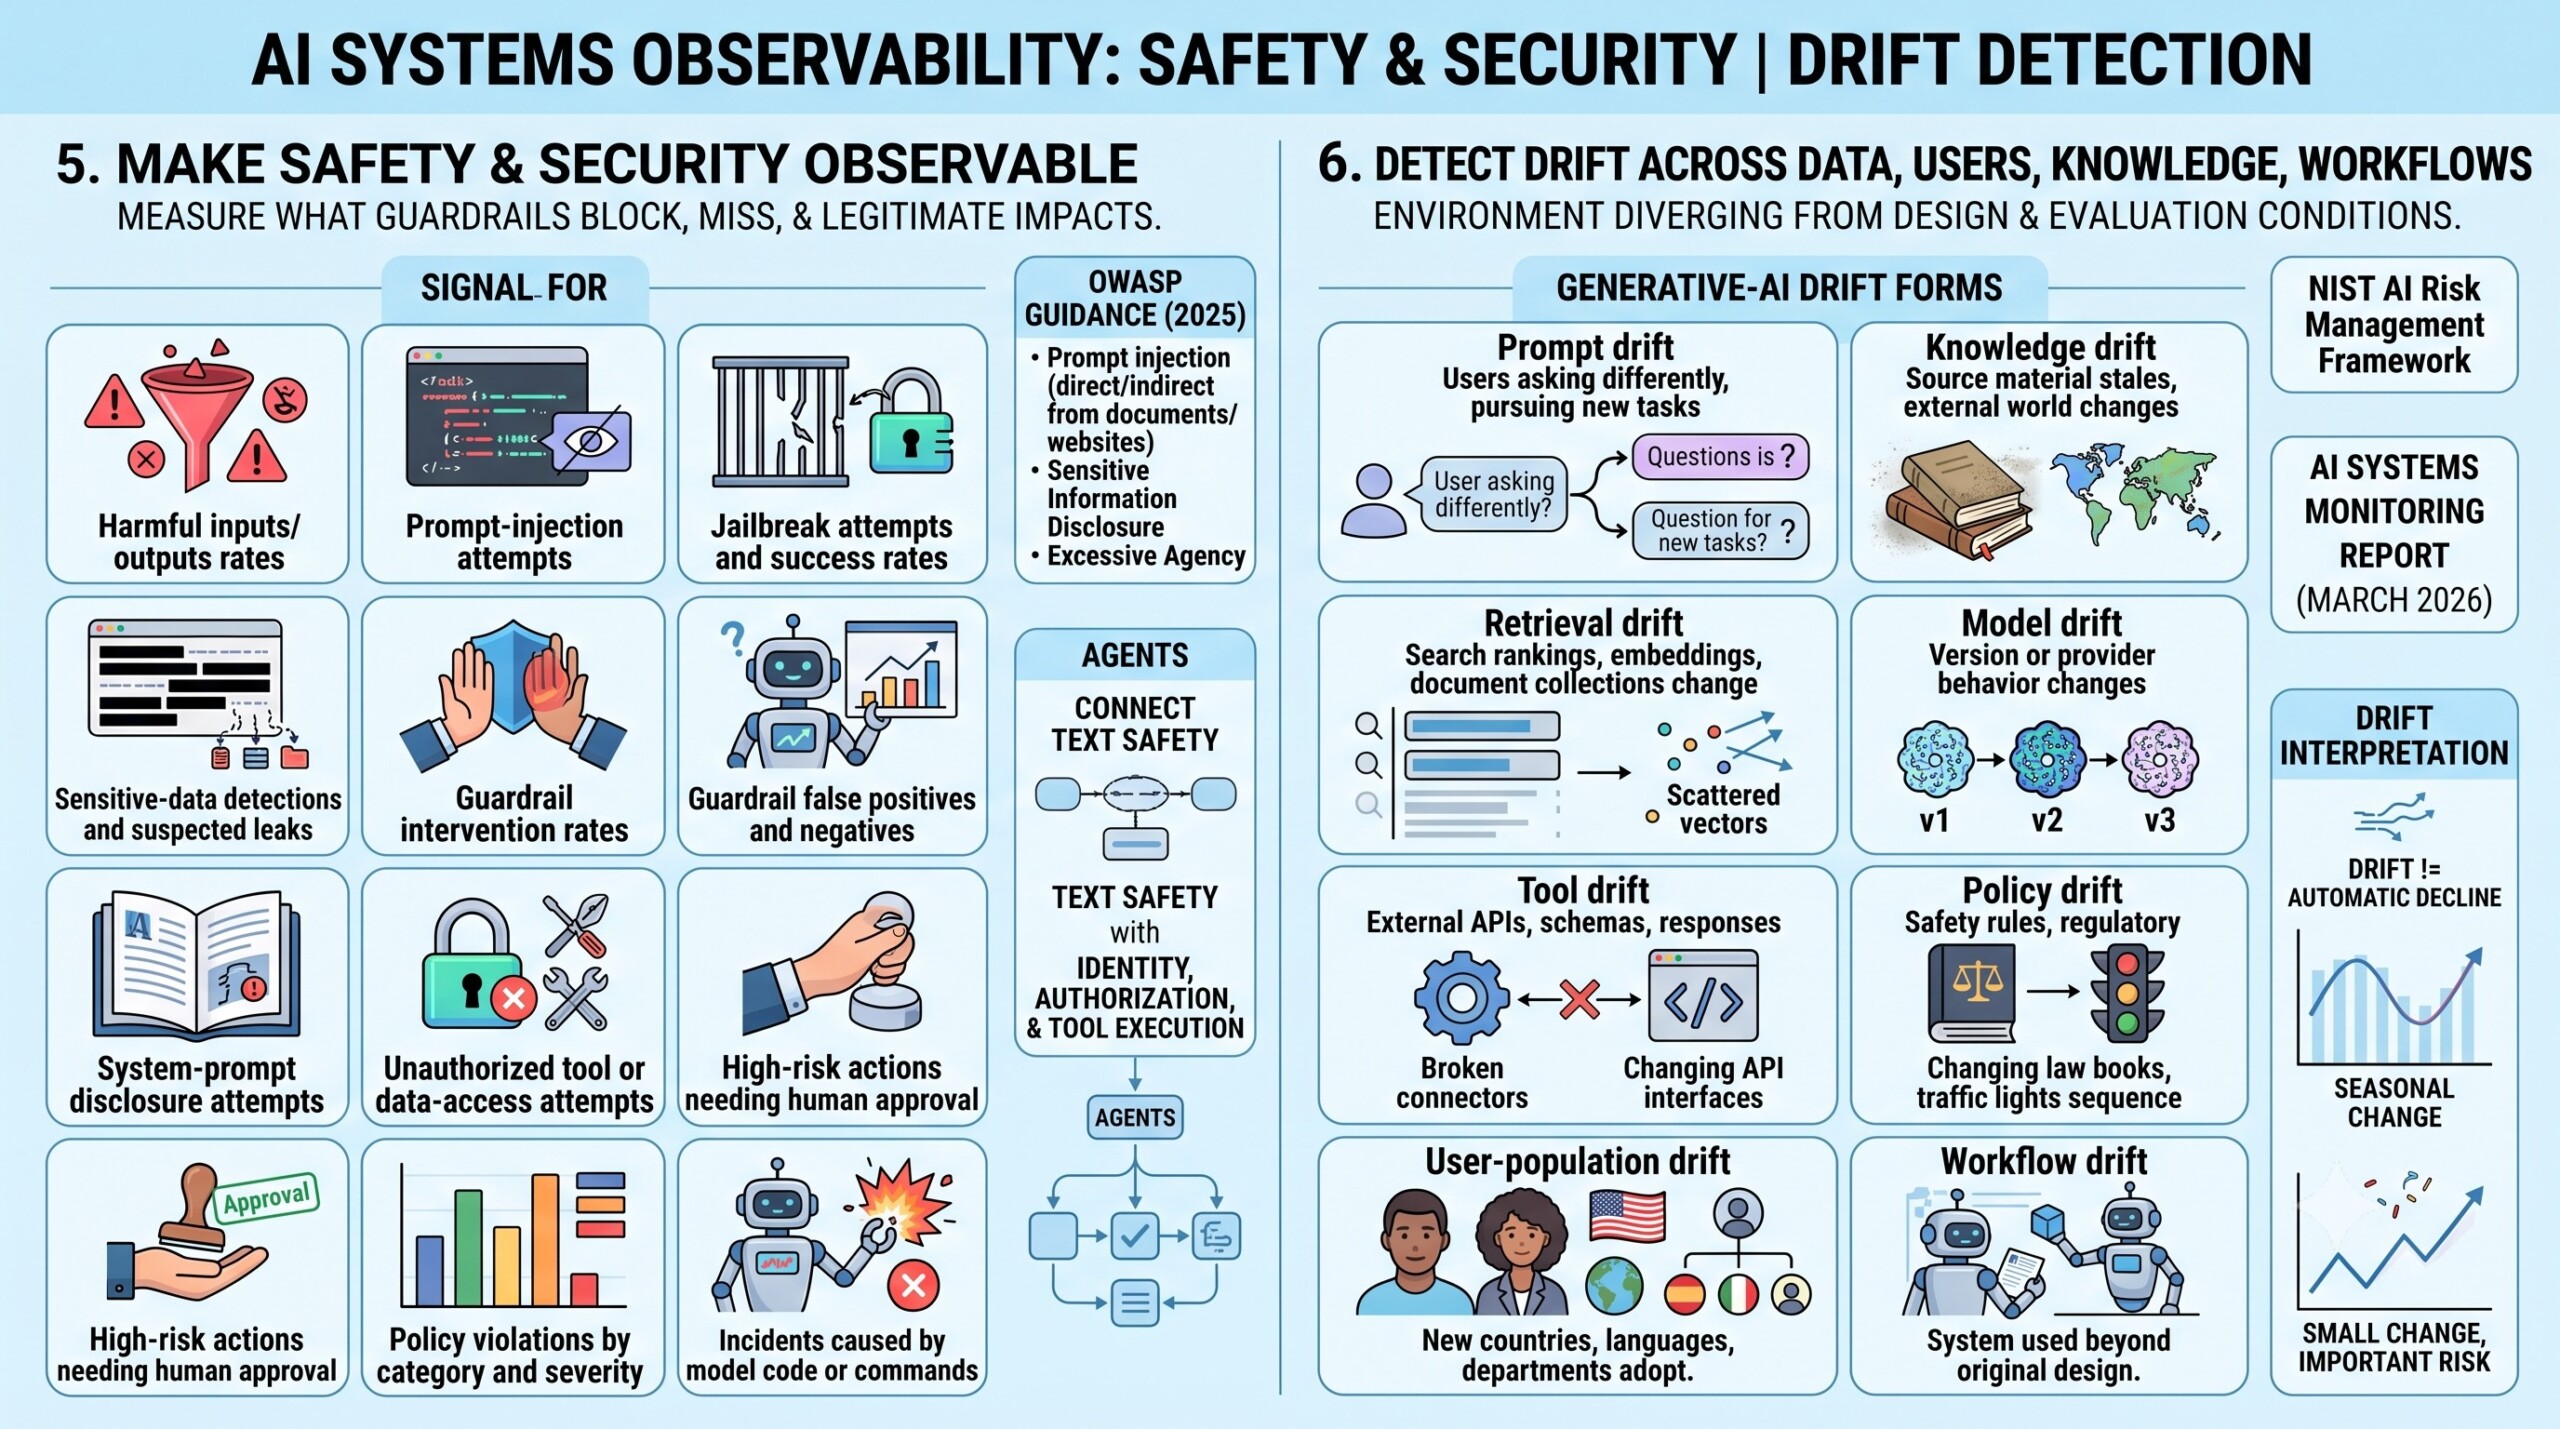
5. Make safety and security observable
A guardrail is not proven effective merely because it has been enabled. Organisations must measure what it blocks, what it misses and how it affects legitimate users.
Relevant safety and security signals include:
- Harmful-input and harmful-output rates
- Prompt-injection attempts
- Jailbreak attempts and success rates
- Sensitive-data detections and suspected leaks
- Guardrail intervention rates
- Guardrail false positives and false negatives
- System-prompt disclosure attempts
- Unauthorised tool or data-access attempts
- High-risk actions requiring human approval
- Policy violations by category and severity
- Incidents caused by model-generated commands or code
OWASP’s 2025 guidance identifies risks such as prompt injection, sensitive-information disclosure, improper output handling, excessive agency, misinformation and unbounded consumption. Prompt injection can originate directly from a user or indirectly from documents, websites and other material processed by an AI system.
This is particularly important for agents because unsafe text can become an unsafe action. A chatbot might generate an inappropriate sentence; an agent with excessive permissions might send a message, alter a database or execute an unauthorised transaction.
Monitoring must therefore connect content safety with identity, authorisation and tool execution. Record what the agent attempted, which policy permitted or rejected it, whether approval was obtained and what actually happened.
6. Detect drift across data, users, knowledge and workflows
Drift occurs when the environment in which an AI system operates moves away from the conditions under which it was designed and evaluated.
For conventional machine learning, teams usually examine input-data drift, prediction drift and concept drift. Generative-AI applications introduce additional forms:
- Prompt drift: Users ask questions differently or pursue new tasks
- Knowledge drift: Source material becomes stale or the external world changes
- Retrieval drift: Search rankings, embeddings or document collections change
- Model drift: A model version or provider behaviour changes
- Tool drift: External APIs, schemas or tool responses change
- Policy drift: Safety rules or regulatory requirements evolve
- User-population drift: New countries, languages, departments or customer groups adopt the system
- Workflow drift: The application is used for purposes beyond its original design
NIST’s AI Risk Management Framework notes that AI systems may require corrective maintenance because of data, model or concept drift. Its March 2026 monitoring report also highlights the difficulty of recognising when a deployed model has become stale.
Drift does not always mean that performance has declined. A seasonal change in customer questions may be harmless. A statistically significant change in word distribution may have little business impact. Conversely, a small change in the proportion of high-risk queries may be important. Excellent individualised mentoring programmes available.
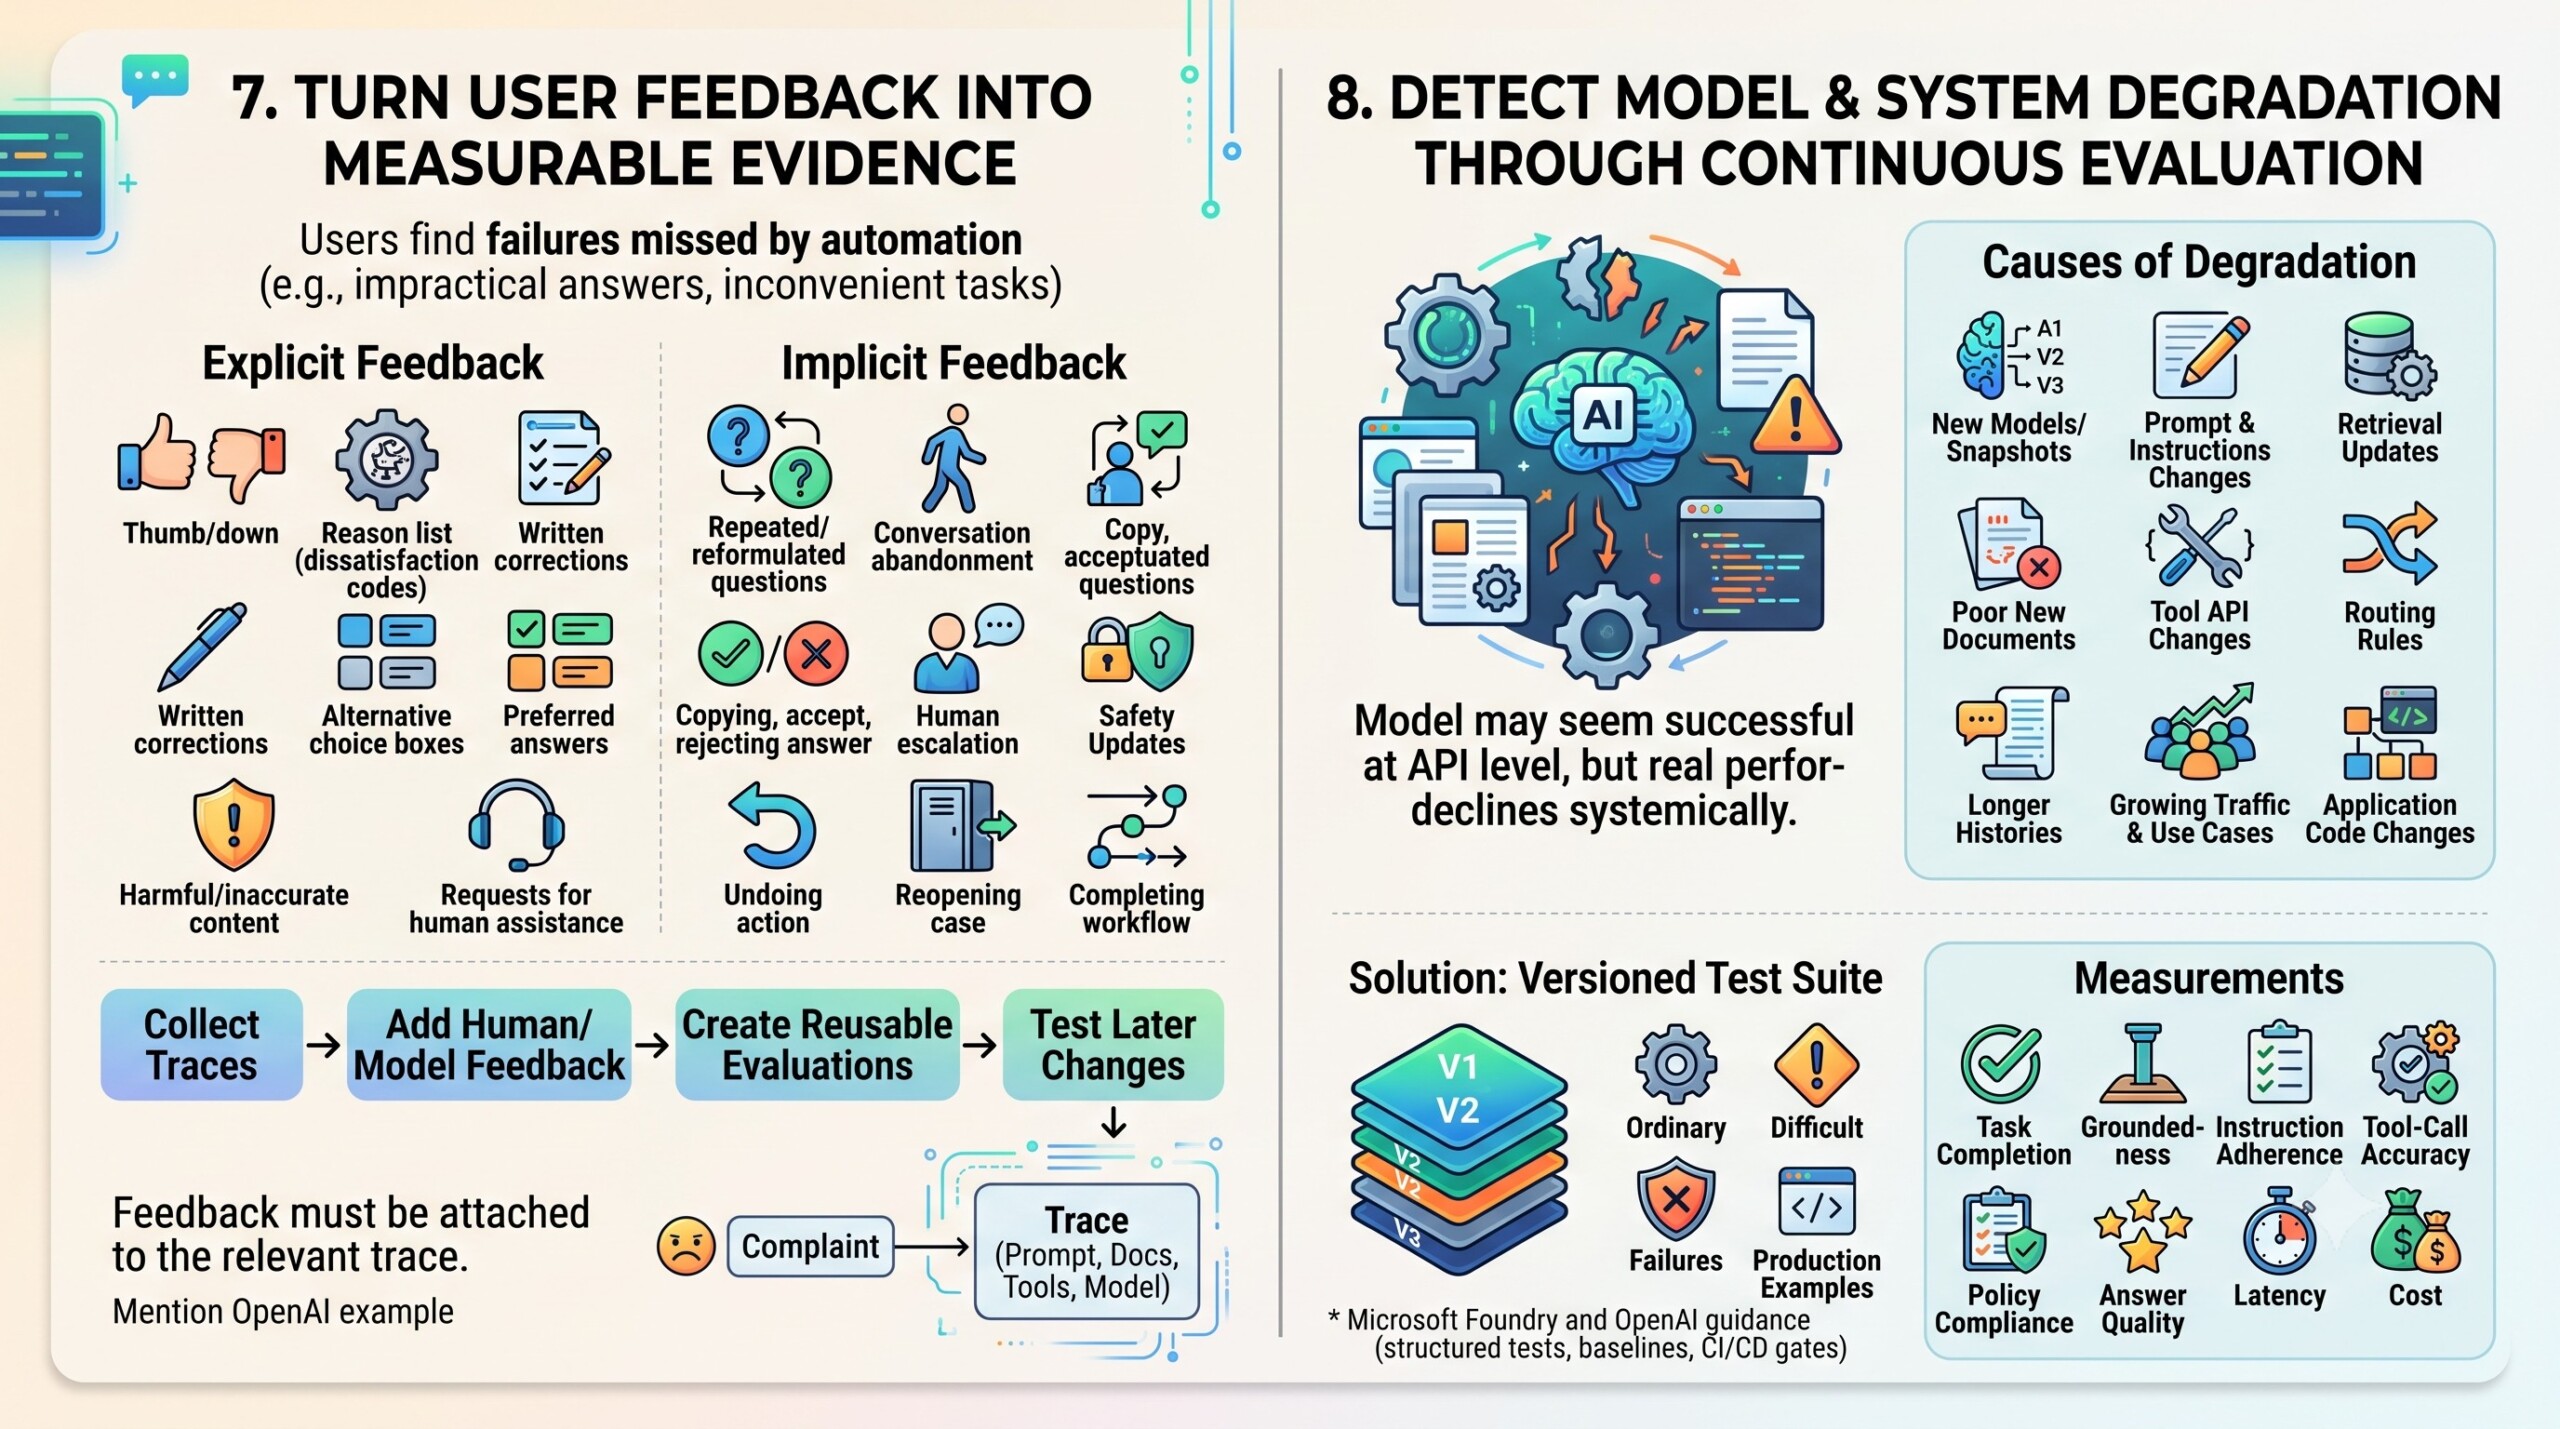
7. Turn user feedback into measurable evidence
Users frequently discover failures that automated evaluators miss. They notice when an answer is impractical, a recommendation ignores organisational context or an agent technically completes a task in an inconvenient way.
Useful explicit feedback includes:
- Thumbs-up or thumbs-down ratings
- Reason codes for dissatisfaction
- Written corrections
- Preferred alternative answers
- Reports of harmful or inaccurate content
- Requests for human assistance
Implicit feedback can be equally revealing:
- Repeated or reformulated questions
- Users abandoning a conversation
- Copying, accepting or rejecting a generated answer
- Escalation to a human employee
- Undoing an agent’s action
- Reopening a supposedly resolved case
- Completing or failing to complete the intended workflow
Feedback should be attached to the relevant trace. A generic complaint that “the assistant was wrong” is difficult to use. A trace can reveal the prompt, documents, tools, model version and output that produced the problem.
OpenAI’s May 2026 agent-improvement example illustrates a broader production pattern: collect traces, add human and model feedback, turn recurring issues into reusable evaluations, and use those evaluations to test later changes.
8. Detect model and system degradation through continuous evaluation
A model may continue to respond successfully at the API level while the application’s real performance gradually declines.
Degradation can arise from:
- A new model or model snapshot
- Prompt or system-instruction changes
- Retrieval-index updates
- New documents with poor quality
- Changes to tool APIs
- Different model-routing rules
- Safety-policy updates
- Longer conversation histories
- Growing traffic from unfamiliar use cases
- Accumulated changes to surrounding application code
Strictly speaking, the model weights may not have degraded at all. The AI system has degraded because one of its interconnected components changed.
Every material release should therefore be evaluated against a versioned test suite. The suite should contain ordinary cases, difficult cases, safety cases, historical failures and representative production examples.
Measurements may include task completion, groundedness, instruction adherence, tool-call accuracy, policy compliance, answer quality, latency and cost. OpenAI describes evals as structured tests for measuring reliability despite the nondeterministic nature of AI systems. Microsoft’s July 2026 Foundry guidance similarly recommends using evaluation baselines, acceptance thresholds, CI/CD quality gates and continuous production evaluation. Subscribe to our free AI newsletter now.
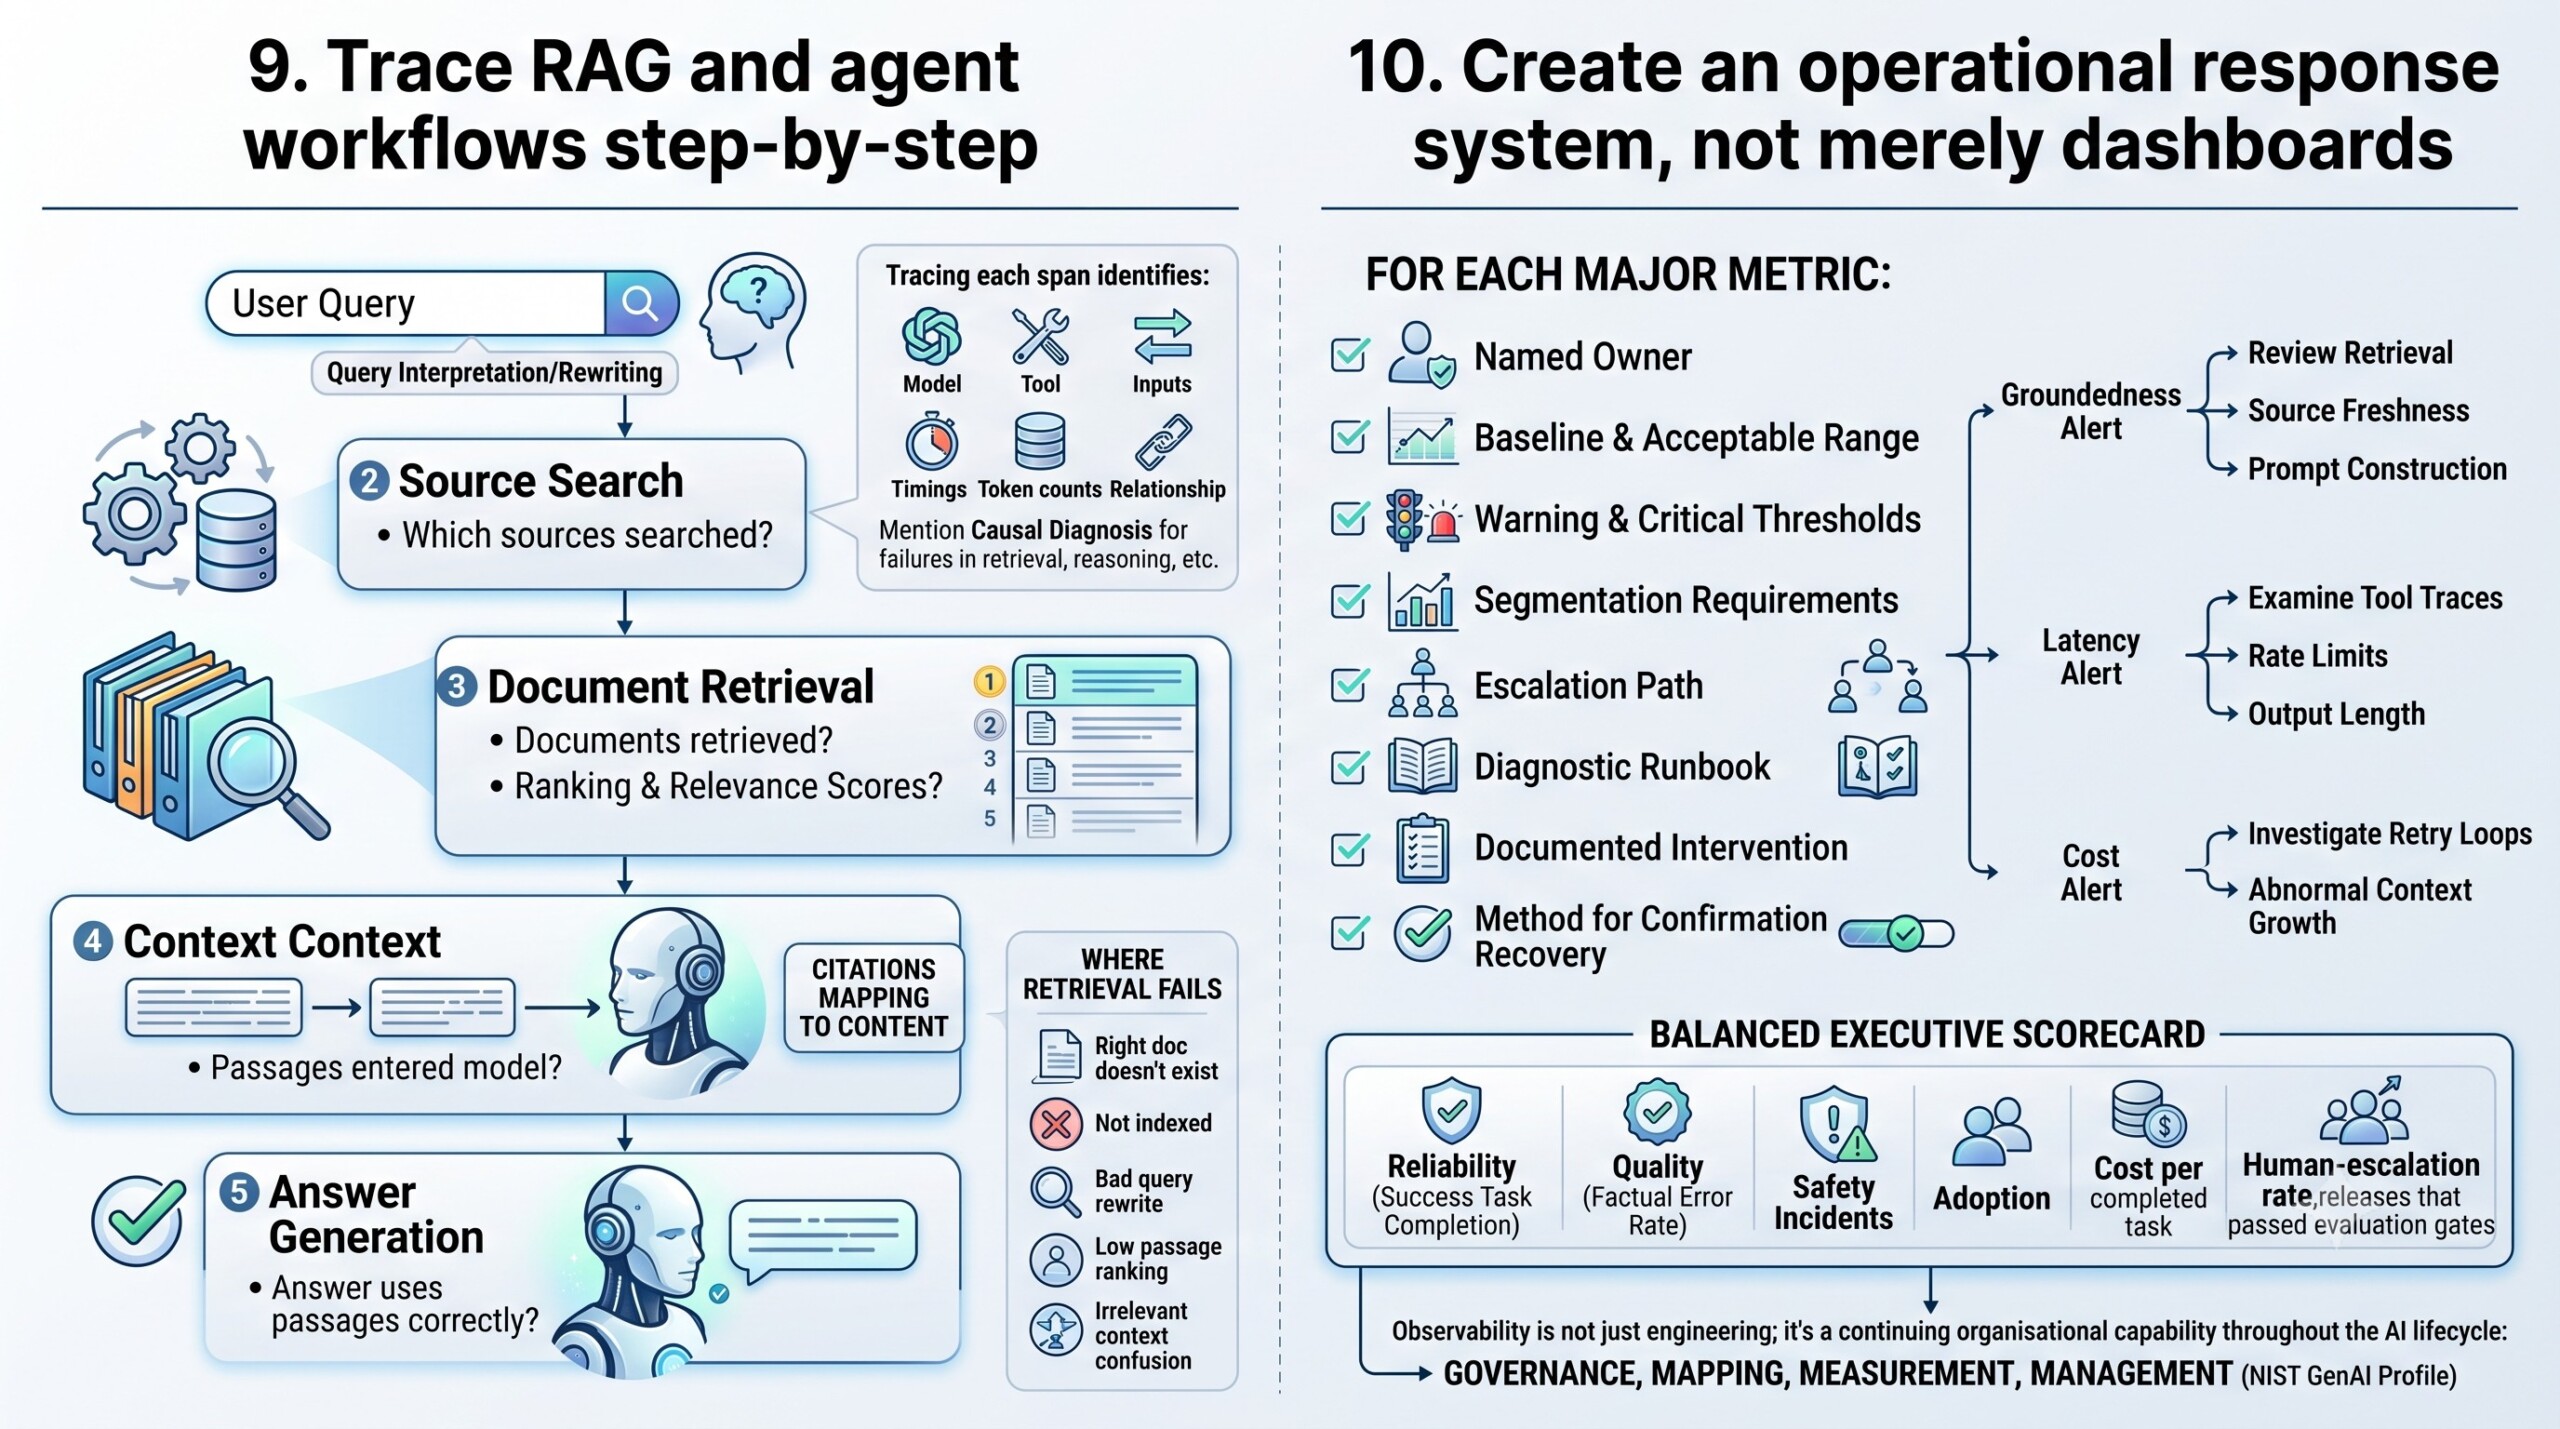
9. Trace RAG and agent workflows step by step
A final-answer dashboard is inadequate for applications built from retrieval, tools and multiple agents.
For a RAG application, observability should cover:
- How the user’s query was interpreted or rewritten
- Which sources were searched
- Which documents were retrieved
- Their ranking and relevance scores
- Which passages entered the model’s context
- Whether the answer used those passages correctly
- Whether citations map to the supporting content
Retrieval can fail even when the model behaves correctly. The right document may not exist in the knowledge base; it may not be indexed; the query may be rewritten badly; the correct passage may rank below the top results; or too much irrelevant context may confuse the model.
Trace quality matters more than trace volume. Each span should identify the model, tool, inputs, outputs, timings, token counts, status and relationship to the parent operation. Sensitive content can be hashed, masked or selectively sampled where full capture is inappropriate.
The objective is causal diagnosis: not merely knowing that an answer failed, but understanding whether the failure began in retrieval, reasoning, tool execution, policy enforcement or response generation.
10. Create an operational response system, not merely dashboards
An observability programme is useful only when signals lead to decisions.
Each major metric should have:
- A named owner
- A baseline and acceptable range
- Warning and critical thresholds
- Segmentation requirements
- An escalation path
- A diagnostic runbook
- A documented intervention
- A method for confirming recovery
For example, a groundedness alert may trigger a review of retrieval quality, source freshness and prompt construction. A latency alert may trigger examination of tool traces, rate limits and output length. A cost alert may initiate investigation of retry loops or abnormal context growth.
Leaders should receive a balanced scorecard rather than a single AI-performance number. It should combine reliability, quality, safety, adoption, cost and business outcomes.
A typical executive view might report successful task completion, factual-error rate, serious safety incidents, p95 latency, cost per completed task, human-escalation rate and the number of releases that passed evaluation gates.
NIST’s generative-AI profile treats risk management as an activity spanning governance, mapping, measurement and management throughout the AI lifecycle. This is the correct perspective for observability: it is not an engineering add-on installed after deployment, but a continuing organisational capability. Upgrade your AI-readiness with our masterclass.
Conclusion
AI observability and monitoring are becoming the quality-control system of the AI-enabled enterprise.
The objective is not to collect every possible metric or preserve every prompt forever. It is to create enough trustworthy evidence to understand how an AI system is performing, why it fails and what intervention is required.
A mature programme connects seven essential dimensions:
Hallucination monitoring tests whether claims are supported.
Latency monitoring protects the user experience.
Cost monitoring links consumption to useful outcomes.
Safety monitoring reveals harmful content, attacks and unsafe actions.
Drift monitoring detects changes in users, data, knowledge and workflows.
User-feedback monitoring captures practical success and failure.
Degradation monitoring identifies regressions across models, prompts, retrieval, tools and policies.
The deeper lesson is that no foundation model operates alone. Production quality emerges from the entire system: data, prompts, retrieval, tools, interfaces, controls, users and organisational processes.
Now leading technical platforms increasingly combine traces, evaluations, monitoring dashboards and continuous quality gates. Yet tools cannot decide what quality means for a particular organisation. That requires domain experts, product owners, security teams, engineers, risk professionals and users to agree on acceptable behaviour and measurable outcomes.
The organisations that gain lasting value from AI will not be those that merely deploy the most models. They will be those that can observe their AI systems honestly, detect deterioration early and improve them continuously.